Staff
Leslie Weinsheim
Director-Institutional Research, Planning & Development

Sign up for Fall 2026 Registration Day Registration Day | Northeastern Junior College

Highlights
90% strongly agree or agree that Northeastern helped them reach their education objectives.
72% feel they are extremely or very well prepared to undertake their future plans after attending Northeastern.
38% plan to transfer to a 4-year university.
24% plan to find permanent employment.
Methodology
The 2025 Graduate Survey was available to all graduating students through Desire2Learn and conducted from April 14 through May 19, 2025. Responses and results were obtained using Microsoft Forms.
This year, there were 111 respondents which accounts for 35% of the approximately 318 students1 who had applied for certificates and degrees for Spring 2025. Some percentages shown will not add up to one hundred due to multiple answers for some questions as well as rounding issues.
1Based on students who have applied to graduate, number of actual graduates not available until mid-June 2025.
Northeastern is committed to using the results of this survey to further the success of all students and thanks every graduate for their responses and time in completing this survey.
One hundred eleven graduates (111) participated in the survey this year.
Cost, location, and academic programs were the top three reasons graduates chose to attend Northeastern. These three reasons have consistently ranked at the top for previous years as well.
Least important reasons were athletics and residence halls.
Thirty-eight percent (38%) of graduates’ plan to transfer to a 4-year university and of those, 93% plan to attend full time. The percentage of graduates planning to attend a 4-year university is slightly higher than the previous year, but lower than the remaining three years.
When asked about reaching education objectives, 90% of graduates responded favorably. This compares to 87% last year.
Graduates indicated that they regard personal satisfaction as the most important factor in choosing a career. Personal satisfaction remains the top choice over the past five years, the type of work remains the second choice for the past five years.
Graduates are feeling more optimistic about their preparedness for their future plans in 2025 than in the previous year. Overall, 72% feel they are extremely or very prepared to take on their future, this compares to 68% for 2024. The percentage of graduates feeling extremely well prepared increased to 27% and those feeling very well-prepared fell to 45%. Twenty-three percent (23%) answered that they felt somewhat prepared.
Twenty-six percent (26%) of graduates worked full time while attending college while 43% worked part time. In the previous year 19% worked full time and 50% worked part time.
Fifty-two percent (52%) of employed graduates state their current job is either directly or somewhat related to their certificate or degree earned at Northeastern. This compares to 39% from 2024 and 49% for 2023.
Forty-two percent (42%) of graduates encountered no obstacles while obtaining their certificate or degree from Northeastern; while 58% did encounter some type of obstacle.
Thirty-four percent (34%) of graduates encountered no obstacles while obtaining their certificate or degree from Northeastern, while 66% did encounter some type of obstacle.
The obstacles (factors) have been divided into three groups based on the sub questions. The first group details obstacles that are related to Northeastern. This group of sub questions asks about class times, issues with courses or advising, which means that the percentage of graduates experiencing these obstacles could possibly be reduced by making positive changes to scheduling or advising. The second group details monetary obstacles and the third group details obstacles that are of a personal nature. Northeastern most likely has limited ability to reduce the percentage of graduates experiencing monetary problems or problems of a personal nature. Keep in mind that, for these groups, graduates could have multiple answers that span one or more of these three groups.
Overall, 41% of graduates had problems getting their certificate/degree. Of those, 33% of graduates said that classes were not offered at convenient times; 22% answered that they encountered problems with a course or faculty member and 16% answered that their advisor gave them the wrong information. Sixteen percent (16%) answered that the classes they needed were not offered at all and 13% answered that tutoring was not available or inadequate.
Twenty-seven percent (27%) of graduates had obstacles related to money. Of those, 18% answered that they had financial aid problems while 9% experienced other monetary problems.
The third group details obstacles graduates encountered that were of a personal nature. Nine percent (9%) of graduates answered that they had encountered a personal crisis, 10% answered that they had issues with employment that interfered with college (this was the largest percentage for this group of factors for 2025; 6% had family obligations, 5% had health issues; 4% had problems with a personal relationship.
The final two questions of the survey are open ended to allow graduates to share their insights about Northeastern. The first of these two questions is: If you could change one thing about Northeastern, what would it be? Overall, 59% had no suggestions for changes or had positive comments such as “Nothing, it was perfect to me.” Quite a few students suggested that having bachelor’s degrees offered would be great.
A few suggestions related to upgrading buildings and landscaping. Another suggested having a better focus on non-traditional students:
“That there would be a department that focuses on non-traditional students. Helping them with what they need, making them feel comfortable and welcome on campus. Too often, when I am on campus, I am the oldest student in the room. I often feel like an outcast. When I talk to others about going back to school, many are too scared and don't know how they can afford it. I found getting scholarships and grants (including the PELL) was much easier than expected. I wish I had known YEARS before that it was so easy, or I would have jumped at this opportunity sooner. Others shouldn't have to feel unwelcome or feel like they can't go back to college, no matter how old they are.”
The final question asks: Share your favorite experience while attending Northeastern.
Many comments talked about meeting new people and making lifelong friends. Many also commented on the dedication of their instructors and advisors.
Here are just a few of these comments:
“Not having to go into a class is great, I love that Northeastern is working with so many colleges across the state. I am not good at getting to places on time and live 15 minutes from town so the online courses are my only option to actually finishing a degree.”
“The ability for one on one and how much individual time students can have with professors/advisors.”
"I’ve attended a few different schools and the staff and faculty at NJC is the most personable, friendly, and inspiring.”
Finally, to end with one more comment:
“At NJC I found a group of lifelong friends and met a ton of amazing people. My favorite experience would simply be meeting the people I have become friends with over the last two years.”
Northeastern Graduate responding to the survey question ……Share your favorite experience while attending NJC.
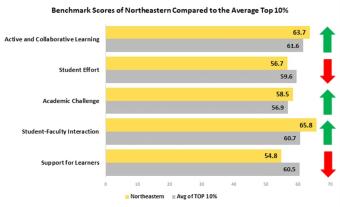
Significant research has been done to show that five areas related to student engagement result in increased student outcomes. Active and collaborative learning, student effort, academic challenge, student-faculty interaction and support for learners comprise these five areas and Northeastern scores high marks in three of the five when compared to the top 10% of all colleges that participated in the survey for 2021.
The chart below shows how Northeastern measures up to the top 10%.
| Highest Aspects of Student Engagement consisted of: |
| 1) Worked with classmates outside of class to prepare assignments (Active and Collaborative Learning) |
| 2) Discussed ideas from readings or classes with instructors outside of class (Student-Faculty Interaction) |
| 3) Worked with instructors on activities other than coursework (Student-Faculty Interaction) |
| 4) Number of written papers or reports of any length (Academic Challenge) |
| 5) Frequency: Peer or Other tutoring (Student Effort) |
| Lowest Aspects of Student Engagement consisted of: |
| 1) Came to class without completing readings or assignments (Student Effort) |
| 2) Number of books read on your own (Student Effort) |
| 3) Extent: Examinations challenged you to do your best work (Academic Challenge) |
| 4) Encouraging contact among students from different economic, social, and racial backgrounds (Support for Learners) |
5) Preparing for class - studying, reading, writing, rehearsing, homework etc... (Student Effort)
NOTE: Northeastern scores higher in Student Effort and Support for Learners when compared to the small colleges cohort and to all colleges overall. Only when compared to the top 10% of all colleges, does Northeastern scored lower. The following five charts show each area and the excerpt of the question that was asked to Northeastern students. Questions that have two asterisks at the end are the questions that had scores high or low enough to have a statistical significance when compared to both, the small college and all colleges cohorts. 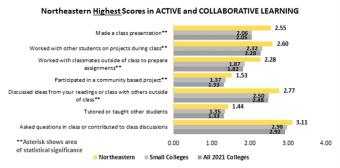
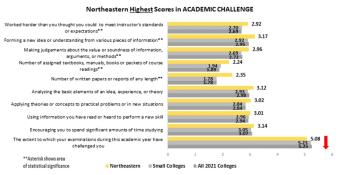
Sixty-two percent (62%) of full-time students (111/180) answered the question “Did you work harder than you thought you could” as very often or often; yet only 32% (56/175) answered the question “The extent to which your examinations challenged you” as extremely challenging or the next highest level below. It isn’t known how students defined extremely challenging; however, on the race/ethnicity questions, students were asked “During the current academic year at this college, my instructors have expressed high expectations of me” and 87% of full-time and 100% of part-time students strongly agreed or agreed with this statement which equates to 166 of 189 students. This is puzzling because it seems to be a mismatch in the interpretation of these questions. Northeastern scored high in all areas of the Student-Faculty Interaction questions. 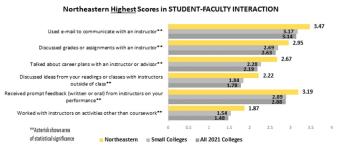
Northeastern scored lower in the area of Student Effort. When looking at responses from full-time students regarding use of skills lab, 47% answered N.A. and 5% did not use at all. Similar answers were found when asked about use of the computer lab with 45% for N.A. and 4% for did not use at all. Questions were also asked about the importance of these services and for both the skills and computer labs, less than 40% answered very important. Could this be an indication that students didn’t know about these services? Could more be done to alert students to the availability and importance of these services? 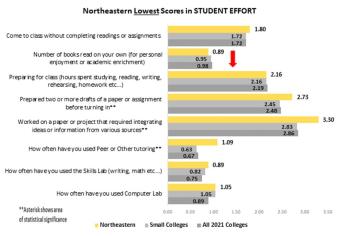
Northeastern scored lower in the area of Support for Learners. Full time students felt they did not receive as much encouragement as they could have to be diverse in the students they associate with; and 63% of full-time students felt they didn't get enough help coping with non-academic responsibilities like work or family issues. 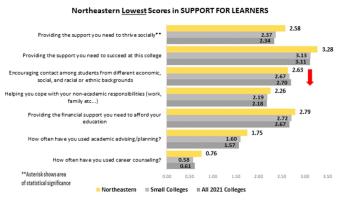
Overall, Northeastern is doing very well in all five of these areas, but there were some questions that did not receive enough positive responses, particularly from full-time students, that merit further investigation. When looking at Student Effort, the number of books students read outside of class could be higher and the high amount of N.A. and did not use at all responses regarding the skills and computer lab need further discussion about how to increase the use of these valuable services. Student Perceptions on Issues of Race and EthnicityNortheastern elected to have students answer additional questions related to race and ethnicity. Some of the questions asked students if their advisors or instructors were the same ethnicity as they were; or if the other students they encountered in class were the same race and ethnicity. Not surprisingly, the answers to these questions lined up almost perfectly with the Northeastern demographic of race/ethnicity which is over 70% White Non-Hispanic and just under 30% Students of Color. Northeastern knows that the demographic of instructors/advisors is lower than the student demographic and is working to change this. Hiring more faculty and staff that are non-white is a key strategy in the most recent strategic plan. For this reason, these questions are not covered here; however, questions that are covered show areas where Northeastern could improve. In answering the question "During the current academic year at this college, my instructors have included topics and perspectives focused on race and ethnicity in my classes." Only 13% of part-time and 27% of full-time students answered Very Often or Often. Nearly 38% of full-time and 40% of part-time students answered never. Northeastern had created Northeastern Nation in 2018, to bring awareness to issues of race and ethnicity and to improve classroom teachings on issues of race and ethnicity. Higher percentages in the very often and often section is the goal. The COVID pandemic slowed this important work; however, it is clear from the answers of students that more needs to be done to bring examination of these issues into the classroom. In answering the question "During the academic year, I have experienced college staff and faculty members taking a stance against stereotypes about students of color." Since the Northeastern race/ethnicity demographic is over 70% White Non-Hispanic, it is interesting that nearly 60% of full-time (103/172) and nearly 69% of part time (11/16) students answered strongly disagree or disagree. With the high percentage of answers in disagreement with this statement, it appears that the majority of Northeastern students believe that more should be done on campus by faculty and staff to make sure students of color do not face any stereotypes. In answering the question "During the academic year, I have participated in activities or discussions outside of class that encouraged me to examine my understanding of issues of race and ethnicity." Nearly 40% of full time students answered Never and nearly 32 percent answered Sometimes. This is also an area that Northeastern Nation hopes to focus on in coming semesters with the goal of increasing the percentages of Very Often and Often. In answering the question "During the current academic year at this college, I have personally experienced racism." Since the Northeastern race/ethnicity demographic is over 70% White Non-Hispanic, it is expected that the majority of students would answer no to this question; however, nearly 9% of students answered strongly agree or agree. Even though this number is a small amount of students, it does show that at least 17 students have experienced an issue in the last year. It is possible there could be more students. Overall, Northeastern has a great deal to be excited about when looking at the sum of the survey results. As a small rural college struggling with budget issues, managing operations during a world-wide pandemic and always having to figure out how to do more with less personnel, the majority of these results are fantastic news. However, the survey results have uncovered a few areas in need of improvement. In terms of student engagement, more students need to answer key questions more positively. How can Northeastern get students to recognize the importance of, and use the valuable services of the skills and computer labs? How can Northeastern get students to read more books that are not assigned in class to improve their personal enrichment and knowledge? How can Northeastern give students more support with regard to non-academic issues such as work and family? How can Northeastern focus on topics of race and ethnicity inside and outside the classroom and how can Northeastern reach a point where zero students answer that they have experienced racism on this campus? Finding the answers to these questions and implementing solutions will hopefully result in more positive outcomes for students and more positive answers on the next CCSSE Survey. The results of this survey show that with a few improvements, Northeastern is fully capable of being in the top 10% of all community colleges in the five areas of student engagement and capable of bringing more awareness to issues of race and ethnicity. More About CCSSEThe Center for Community College Student Engagement was established in 2001 as a project of the Community College Leadership Program at the University of Texas at Austin (UTA). Governance of this project is maintained by the Department of Educational Leadership and Policy at UTA, along with a National Advisory Board that includes community college presidents and state directors of community colleges. Grant funding from organizations such as the Lumina Foundation, Bill and Melinda Gates Foundation, PEW Charitable Trusts and the Carnegie Foundation for Advancement of Teaching (to name a few) support this important research initiative. The Community College Survey of Student Engagement (CCSSE), is a benchmarking tool that establishes national norms on educational practice and performance; the survey also serves as a diagnostic tool, identifying areas where a college can enhance students’ educational experiences; and finally it is a monitoring tool to be used over time to help a college improve its educational (or institutional) effectiveness. This survey is based on extensive research into educational practices that are directly related to increased positive student outcomes, and helps community colleges respond to the increasing expectations of proving quality, performance and accountability. CCSSE is used by hundreds of community colleges across the United States including, at times, colleges in the CCCS system. For the 2021 survey, Northeastern was the only college in the system to conduct the survey and it seems to be the only college in Colorado to participate this year as well. There were 135 colleges in the small college cohort from all parts of the United States. The survey itself is comprised of 47 questions, with some of those having as many as 19 sub-questions; and if selected by the college, a set of 20 additional questions can be added regarding a variety of subjects. Northeastern added the Race and Ethnicity set. The results are comprised of a whopping 169 pages that includes instructions on how to interpret the various reports along with all those various reports. Results are split into all students and then into full-time and part-time student reports. A sample copy of the survey and the full report of results is available in the Northeastern Institutional Research Office. |